
The FTSE 100 index had its worst quarterly performance since the last quarter of 1987 after the effects of Black Monday and turmoil on global stock markets.
The index finished the first quarter of 2020 down 27.3 per cent mirroring the downturn of 27.8 per cent in the last quarter of 1987.
The graph below would show the performance of each portfolio, including all costs if each risk category were invested 100 per cent into the portfolio.
Portfolio Performance Quarter 1 2020 – FE Analytics
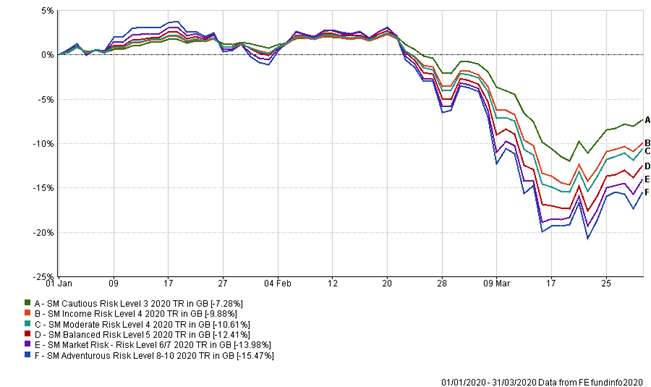
However, I have not rebalanced anyone’s portfolio since the last quarter of 2019, and therefore the actual performance differs from the graph below.
I have calculated the average performance of each clients portfolio in its given risk category and the data is detailed below: –
Average Client Performance Quarter 1 2020 – Wrap Portfolios
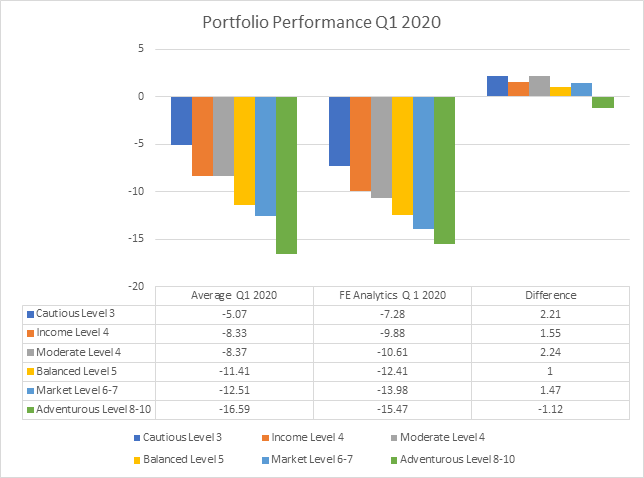
The performances differ due to holding more cash in all portfolios (excluding Adventurous) and therefore when markets started to fall the equity content was approximately 2 per cent less, and the cash position was 2 per cent more than it should have been.


